Excel & VBA---Brain Training
누적 바챠트 응용
누척챠트는 응용하면 할 수록 흥미롭다
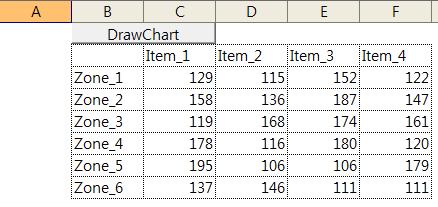
그림과 같은 테이블과 버튼을 만들기 위하여
아래의 구문을 실행하면 된다
이 정도 구문이야 모두 다 잘 해석하고 있다고 믿고..
Sub CreateSourceTable()
Dim iCol As Integer, iY As Integer
Dim iRow As Integer, iX As Integer
Dim oSht As Worksheet
iCol = 5
iRow = 7
Set oSht = Worksheets.Add
With oSht.Cells(2, 2)
For iX = 1 To iRow
For iY = 1 To iCol
With .Cells(iX, iY)
If iX >= 2 And iY = 1 Then
.Value = "Zone_" & iX - 1
ElseIf iX = 1 And iY > 1 Then
.Value = "Item_" & iY - 1
ElseIf iX > 1 And iY > 1 Then
.Value = Int(Rnd() * 100) + 100
End If
End With
Next
Next
With .CurrentRegion
.BorderAround xlSolid, xlHairline
.Borders(xlInsideHorizontal).Weight = xlHairline
.Borders(xlInsideVertical).Weight = xlHairline
End With
With oSht.Shapes.AddFormControl(xlButtonControl, _
.Offset(-1).Left, .Offset(-1).Top, _
.Width * 2, .Height)
.TextFrame.Characters.Text = "DrawChart"
.OnAction = "DrawChart"
End With
ActiveWindow.DisplayGridlines = False
End With
End Sub
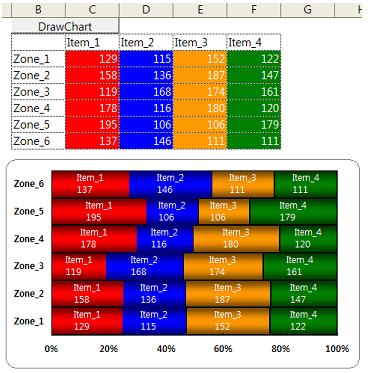
위의 코드로 만들어진 테이블상의 버튼을 크릭하면
아래의 그림과 같은 챠트가 그려지게 하는 문제
챠트를 손으로 그리는 것 보다는
훨씬 정교하게 정확한 원하는 위치에 생각한대로 그릴 수 있다는 것은
즐거운 프로그래밍의 결과이고 목적이다
또한 챠트원본의 테이블의 바탕색도 챠트의 계열과
같은 색으로 표현하여 식별하기 좋게 한다
자동화로 자~알 그려 보는 문제..
Chart개체와 ChartObject개체를 자주 헷갈린다
ChartObject는 Chart개체를 담고 있는 도형으로 생각하시면 좋다
챠트를 그릴 범위가 rData 라는 변수에 담겼다면
Dim oChartObj As ChartObject
With rData
Set oChartObj=.Worksheet.ChartObjects.Add(.Left,.Top,.Width,.Height)
End With
와 같이 빈 도형이 하나 만들어지는 것이 ChartObject인 것이고
Chart개체는 위의 ChartObject에서 아래와 같이 얻어진다
Dim oChart As Chart
Set oCahrt=oChartObj.Chart
이렇게 Chart개체를 얻은후 챠트의 모든 내용이 처리가 되는 것이다
With oChart
...
...
...
...
...
End With
와 같이하여 또 Chart개체가 갖고 있는 작은 개체들의
항목,값축을 표현하는 Axis개체,
항목의 값을 표시하는 TickLabels개체
계열을 표현하는 Series 개체
서식과 메소드를 처리해주면 되는 조립품인 것!!
 BrainTraining_039_stackedBarChart.
